
The sample size can not be less then 3 observations. There is no upper limit. The demo version takes the first 12 samples.
The data can be located in either rows or columns (radiobutton “Grouping”).
If there are no sample names, the program gives them the default names of Var1, Var2 … VarN.
The table with data has to be separated from the rest by empty row and column or the sheet edges.
To input basic data and indicate the location for the results, you have to:
Set “Names” checkbox;
Select the “Grouping” radiobutton value;
Press the “Input” button.
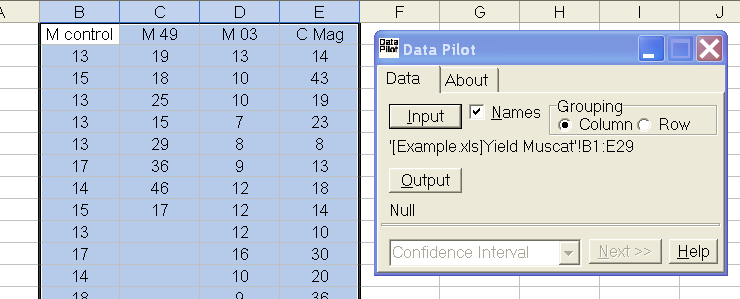
After you do this, Excel with select the data area. Its coordinates will be recorded below the “Input” button.
Note. Please remember that the data inputs right when the button “Enter” is pressed. If the data has changed, you have to enter it again.
To indicate where the results should be entered, select any cell in the Microsoft Excel sheet and press “Output” button.

Right after this, the coordinates of the top left cell of the results area will appear below the “Output” button. Take a note that the calculation method selection field and the “Next >>” button that executes it became available.
Note. Please keep in mind that the contents of the cells to the right and below will be overwritten with the calculation results.
The results can be located on the same sheet, a different one or in a new Excel book.